UK businesses are facing a productivity problem that rarely appears on a single line in the P&L — but the data is hard to ignore.
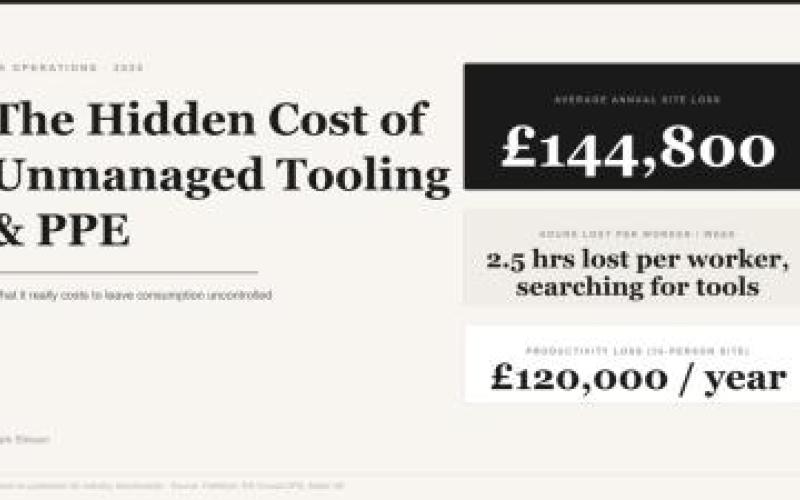
Research across 250 senior industry professionals found that the average frontline employee loses 2.5 hours per week simply locating the tools and components they need to do their job. In a quarter of cases, that figure rises to 3–4 hours. Scaled across the UK's 2.7 million manufacturing workforce alone, that equates to 351 million hours of lost productivity every year — and the same pattern plays out across logistics, facilities, IT operations and asset-intensive industries.
For a mid-sized site of 50 people earning an average of £20 per hour, that single issue alone costs in the region of £120,000 annually — before a single unit of PPE or consumable is factored in.
WHERE THE COSTS ACTUALLY SIT
Most operations managers will tell you they have a handle on MRO and PPE spend. What they're usually tracking is purchase cost. What they're rarely tracking is consumption cost — and the gap between the two is where the real money goes.
Industry benchmarks put MRO spending at between 0.5% and 4.5% of annual revenues. For an SME turning over £3–5M, that's anywhere between £15,000 and £225,000 per year. But the purchasing figure only tells part of the story.
When you add the full picture — over-issuance, waste, emergency purchasing premiums, and the admin burden of manual reordering — the total cost of unmanaged consumption for a 50-person operation looks closer to this:
Productive time lost searching for tools & PPE — £120,000
Over-issuance, waste & untracked consumption — £16,000
Emergency & spot purchasing premium — £6,400
Manual ordering & reconciliation admin — £2,400
Total annual cost of unmanaged consumption — £144,800
These aren't theoretical numbers. Each line is traceable to published research and industry benchmarks.
THE VISIBILITY PROBLEM
The reason these costs persist isn't negligence — it's invisibility.
When a worker picks up a pair of gloves, takes a drill bit, or uses the last box of cable ties, that transaction is rarely recorded. There's no consumption data, no issuance history, no signal that something is running low until it's already gone. At that point, the response is typically a reactive purchase at a premium, or operational delays while someone tracks down a supplier.
A 2025 procurement report by RS , produced in partnership with the Chartered Institute of Procurement & Supply, found that 62% of UK businesses cited reduced operational budgets as a top concern — up from 31% the previous year. Yet the same report found a significant proportion had no clear view of what processing a single MRO order actually costs them.
You cannot reduce a cost you cannot see.
WHAT CONTROLLED DISPENSING CHANGES
Point-of-use vending addresses each of these cost drivers at source. Access is tracked to the individual. Consumption is capped by role or shift. Reorder is triggered automatically at preset levels. And critically, the data exists — which means it can be managed, reported on, and continuously improved.
This isn't a manufacturing-only solution. Any operation where people access tools, PPE, consumables or high-value components on a daily basis faces the same underlying problem — and the same opportunity to recover cost.
Conservative recovery estimates based on industry experience suggest:
Productivity (60% recovery of lost search time) — £72,000
Consumable reduction through controlled issuance — £12,000
Reduction in emergency purchasing — £4,480
Admin time saved on manual ordering — £1,920
Total annual saving — £90,400
Against a fully-managed annual solution cost of around £9,000, the net benefit is approximately £81,000 — a payback period of under six weeks.
THE BROADER PICTURE
The businesses getting ahead of this aren't necessarily the largest or the most technologically advanced. They're the ones that have decided to treat consumable spend as a controllable variable rather than an unavoidable overhead.
Whether you run a production facility, a logistics hub, a field service operation or a multi-site asset management function — the numbers make the case.
The question is what to do with them.
Figures are based on published UK research and industry benchmarks including data from Pathfindr, RS Group/CIPS, Make UK and The Manufacturer. Site-specific analysis is available on request.
— Mark Stinson
Senior Key Account Manager | Driving MRO Supply Chain Efficiency with Intelligent Operations | Supporting Distributors & Industrial Clients | MRO, Cutting Tools, PPE, IT, Data & Logistics Solutions
How Can We Help?
For more information about our products or company, please get in touch.
Contact Us